Accounting Software
Best Metrics: Average Benefits
Helping you understand the metrics that Peerview Data can help you track and analyze and why your company needs them.
Simplify your workflow with Peerview Data's enhanced customizable graphs! Transform raw data into client-specific insights quickly and efficiently.
As a CPA, you’re likely no stranger to the deluge of data that comes with managing your clients’ finances. The shift towards Client Advisory and Accounting Services (CAAS) requires a level of data analysis and presentation that can often feel overwhelming. That’s where Peerview Data steps in—designed to simplify your workflow and enhance your consulting services, Peerview Data empowers you to harness the full potential of comparative analytics. Today, we’re excited to highlight a key feature of our software that’s designed with busy CPAs in mind.
Peerview's dashboard just got better. In the past, you’ve been able to customize which insights you share with each client through the dashboard feature. This means you can quickly and easily arrange them in the order that best supports your consultation goals, providing visuals that drive home key points. This is a powerful capability, enabling CPAs to transform raw data into understandable insights for their clients in just minutes.
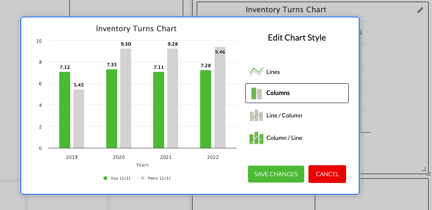
Now, you can take it a step further. With our newly enhanced customizable graphs, you can tailor the information presented even more precisely. By simply clicking the pencil icon in the upper right corner of any view within the dashboard, you unlock a suite of options to refine each chart. These customization options ensure that the insights you provide are perfectly aligned with your client’s needs.
.png?width=445&height=337&name=Untitled%20design%20(56).png)
Transitioning to a CAAS practice model means embracing a more advisory role, where your ability to interpret and communicate data is paramount. Peerview Data’s customizable graphs are more than just a feature—they’re a tool that enhances your consulting capabilities, making the transition smoother and more efficient.
Imagine walking into a client meeting with a dashboard full of tailored, insightful charts that speak directly to their concerns and goals. You can guide your clients through the data, pinpointing trends, identifying opportunities, and providing actionable advice—all without spending hours preparing.
We understand the pressures CPAs face and the importance of delivering value through insightful consultations. That’s why Peerview Data is continually evolving to meet your needs. Our customizable graphs are just one of the many features designed to help you succeed in your CAAS practice.
Take advantage of this powerful tool and elevate your consulting services. Log in to Peerview Data today, click that pencil icon, and start tailoring your dashboards to deliver the insights that matter most to your clients. Together, we can turn overwhelming data into clear, actionable intelligence—empowering you to provide exceptional value and grow your advisory practice.

Or get personally tailored assistance getting started with Peerview Data:

Helping you understand the metrics that Peerview Data can help you track and analyze and why your company needs them.
In this day and age you've GOT to be efficient. Peerview Data can help.
Helping you understand the metrics that Peerview Data can help you track and analyze and why your company needs them.