

To navigate to the Forecast page, select the Forecast tab in the top-left corner of the webpage.

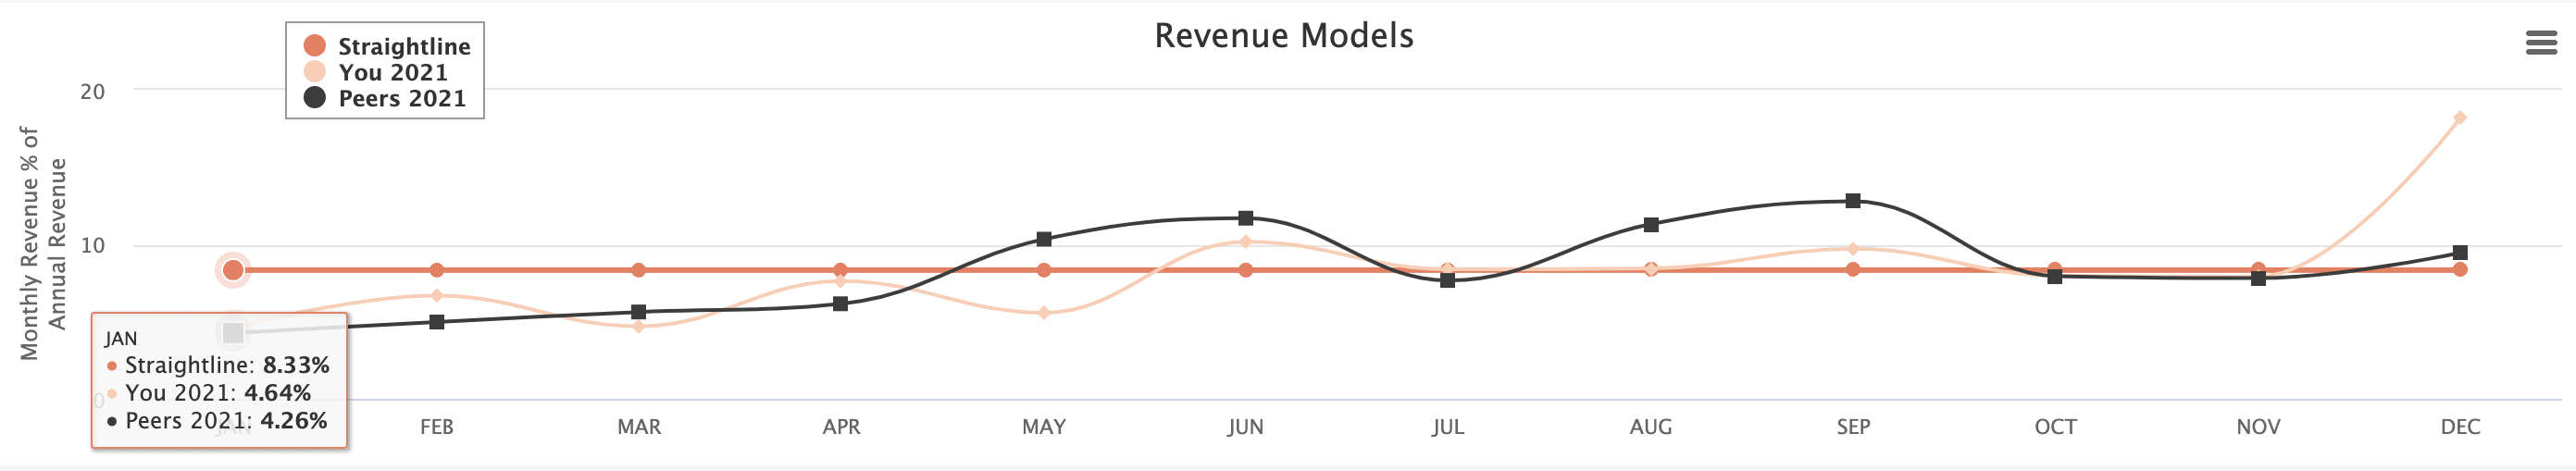
Once inside the page, you will see a Revenue Models chart on the top of the page. When connected to a monthly updating system such as QuickBooks Online or Xero, you will see the monthly revenue % compared to their peers for each month in the previous year.
Below this chart, you will see the Forecast Scenario section. The yearly projections can be changed by either using the Sliders tab or my manually changing the amounts in the Inputs tab.


In the top right of the Forecast Scenario section, one can choose for which year that they would like to create a scenario.

Your custom scenario can be saved by typing in the outlined box in the middle of the page & can be loaded by using the adjacent drop down bar. Also, the Sync Live Data button can be used to show year-to-date data.

Remember: