manufacturing
Best Metrics: Manufacturing Industries
Discover essential metrics for CPAs advising Manufacturing clients. EBITDA, employee retention, inventory turns, and more insights!
How CPAs can enhance client advisory services in transportation and logistics and drive consulting revenue with insightful financial metrics.
Discover how CPAs can enhance client advisory services in transportation and logistics with Peerview Data. Drive consulting revenue with insightful financial metrics.
When we refer to the transportation and logistics industry, we are addressing two interconnected components. The transportation aspect involves trucking and freight hauling operations. In contrast, the logistics side encompasses Third Party Logistics (3PL) providers, which are non-asset-based companies that typically facilitate the brokering of trucking services.
When a CPA is advising a company in the transportation and logistics industry for long-term sustainable growth, several key metrics should be considered. Here are five of the most important metrics, along with specific targets based on industry standards:
- Liquidity
- Labor Costs
- Repairs and Maintenance
- Gross Profit Margin
- Return on Assets
Let's dive a little deeper on each of these and how they will relate to this industry.
Liquidity
Ensuring liquidity is paramount in the transportation and logistics sector, particularly to weather economic downturns effectively. Companies must maintain sufficient cash reserves to sustain operations during challenging times. Liquidity encompasses various critical metrics, including managing receivables efficiently, maintaining an adequate collection staff, optimizing billing practices, securing rate confirmations to expedite payment processing, and renegotiating terms for lines of credit.
One crucial liquidity metric for this industry is the Days Sales Outstanding (DSO).

In this industry, DSO measures the average number of days it takes for a company to collect payment after a shipment is delivered. While the ideal DSO can vary across specific segments of the industry, aiming for around 40 days is generally advisable. By diligently managing liquidity metrics such as DSO and implementing proactive strategies to optimize cash flow, companies can bolster their financial resilience and position themselves for sustained success in a dynamic marketplace.
Labor Costs
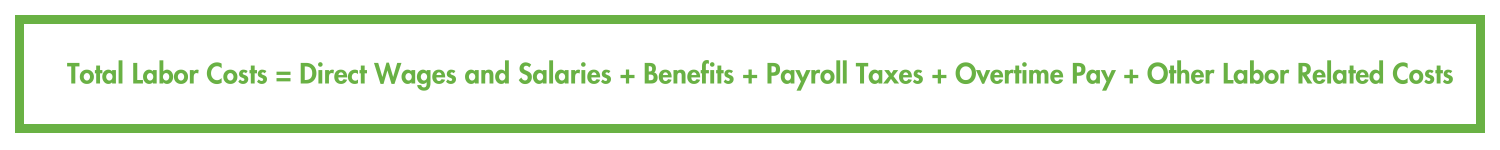
Labor costs can easily become unmanageable in the transportation and logistics industry. To address this, companies should focus on enhancing operational efficiency and carefully structuring incentive plans. Often, incentive programs are not properly aligned with organizational goals, leading to inefficiencies. Key metrics to monitor include pay incentives, overtime expenses, and turnover rates. High turnover rates can be particularly costly, as they often result in increased recruitment and training expenses. By closely analyzing these human capital metrics, companies can identify and address issues contributing to elevated labor costs, ultimately fostering a more efficient and cost-effective workforce.
Repairs and Maintenance
Managing repairs and maintenance is critical in the transportation and logistics industry, significantly impacting a company's bottom line. Maintenance costs can escalate rapidly if not properly controlled, leading to frequent breakdowns that disrupt schedules and increase expenses. A well-structured, preventative maintenance program is essential to enhance operational efficiency, prolong fleet lifespan, and reduce long-term costs. By prioritizing this area, companies can prevent minor issues from becoming major problems, ensuring more predictable and manageable operational expenses and supporting long-term financial stability and growth.
Gross Profit Margin
-1.png?width=515&height=103&name=Financial%20formulas2%20(1)-1.png)
This metric measures the profitability of a company's core operations by assessing the percentage of revenue that exceeds the cost of goods sold. In this industry, a healthy starting point for Gross Profit Margin is around 16%. Achieving this benchmark indicates efficient cost management and competitive pricing strategies.
Return On Assets

A macro metric often overlooked in the transportation and logistics industry is Return on Assets (ROA). ROA is a reliable and comprehensive metric that measures how effectively a company is utilizing its assets to generate profit. It is calculated by dividing net income by total assets, providing insight into the productivity and efficiency of the company's asset management. Ideally, companies in this industry should aim for a ROA of 5% or higher. Achieving this benchmark indicates that the company is using its assets efficiently to drive profitability and sustainable growth.
When evaluating these 5 metrics, it is advisable to review them on very tight cycles, ideally examining key performance indicators (KPIs) weekly and some even daily. Reviewing these metrics every 2-3 months is insufficient, as issues can escalate rapidly.
Here are some additional areas of advice to consider:
1. Compliance with General Accounting Principles (GAAP): Ensuring that your financial records are properly grouped and accurately recorded is crucial. This organization allows you to benchmark and compare your metrics effectively against industry peers, providing a clear picture of your financial standing and performance.2. Financial Stability: Ideally, financials in the transportation and logistics industry are at their best when they exhibit smooth, consistent performance month over month, rather than experiencing large swings. Consistent financial performance indicates effective cost management and stable revenue streams, which are essential for long-term sustainability and growth. By maintaining financial stability, companies can better plan for future investments and navigate market fluctuations with greater confidence.
3. Diffusion Indicator: The diffusion indicator reflects shippers' confidence in future rate trends. This indicator provides valuable insight into market sentiment and expectations. A reading in the upper 40s is considered very low, indicating a pessimistic outlook. Ideally, we prefer the diffusion indicator to be in the upper 50s to 60s range, suggesting a more optimistic perspective on rate movements. Recently, the indicator has improved, rising into the low 50s, indicating a modest recovery in confidence.
Additional sources for benchmarks in the Transportation and Logistics industry are at the American Transportation Research Institute (ATRI), and the Transportation Intermediary Association (TIA).
From monitoring operating ratios and net profit margins to optimizing gross profit margins and liquidity, staying on top of these key metrics empowers informed decision-making and fosters long-term financial health for your clients. That's why we offer Peerview Data, a comparative analytics and benchmarking platform tailored for CPAs like you. With Peerview Data, you can efficiently manage your clients' data across various industries, providing invaluable insights and strategic guidance to transportation and logistics businesses. Invest in Peerview Data today to enhance your client advisory services and unlock new avenues for consulting revenue growth.
Discover essential metrics for CPAs advising Manufacturing clients. EBITDA, employee retention, inventory turns, and more insights!
One thing that I find in common with CPA firms is that they expect to see strong growth in their Client Accounting and Advisory Services (CAAS)...
Discover how financial advisors can enhance value for winery clients by focusing on goals beyond financials, with expert insights from Geni...