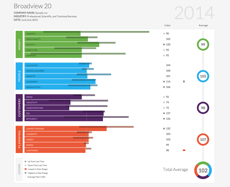
One of the more interesting things our Comparative Analysis & Benchmarking Tool looks at is Accounts Payable Days and Accounts Receivable Days — how long it takes a company to pay and get paid compared to its competitors.
This article and infographic jumped out because it puts a dollar figure on what that means to U.S. small businesses: $825 billion, or about $84,000 per company.

That's the amount of money small businesses are currently owed by their clients and customers.
While the aim of the article is to convince people to pay unpaid invoices faster, which is admirable, it's also worth noting that there's also a strategic aspect to AR and AP Days: if you're paying faster or being paid slower than your peers and competitors you should get something out of that with respect to prices, terms, loyalty, access, order speed or priority, etc.
Why?
Risk — if you consider the fact that cash flow kills 82% of small businesses, according to U.S. Bank, being paid faster directly reduces that risk while being paid slower directly increases it.
Since most companies are on both sides of this equation, it makes sense to periodically evaluate industry norms and see if there's any way to leverage the difference.
_____________________________
Get better insights from the data you already collect.
Companies generate more data than ever before but most of them don't get enough out of it. Our safe, secure Comparative Analysis & Benchmarking Tools take the data you already collect and turn it into competitive insights you can use to improve your performance.
→ Request a no-pressure demo:

_____________________________

