<img height="1" width="1" style="display:none" src="https://www.facebook.com/tr?id=428271980838921&amp;ev=PageView&amp;noscript=1">

Peerview Data Insights

eBook Update: Your copy is available for download

Just a quick post to say we've updated our eBook “20 Competitive Metrics Every Business Needs to Know.

Even if you're not using our competitive analysis & benchmarking tool to cut costs or boost your growth rate, it’s a great, all-around playbook for improving finance, HR, sales & marketing and management.

Topics: Money People Customers Planning & Forecasting Competitive Analytics KPIs Business Performance Small Business big data

The 20 Most Important Metrics In Business: Growth

PLEASE NOTE: the following is an excerpt from "20 Competitive Metrics Every Business Needs to Know," which is now available as a free download here.

Performance MetricGROWTH

Definition:  A RELATIVE MEASUREMENT OF THE YEAR-OVER-YEAR CHANGE IN TOTAL COMPANY REVENUE

Importance:  Growth is a strong indicator of product/market fit, but because it can vary significantly by industry, by year or by company life stage, it should always be benchmarked competitively.

Underlying causes/influencing factors:  

  • price
  • product
  • promotion (marketing)
  • place
  • process
  • partners (vendors, distributors, suppliers, etc.)
  • people (personnel)
Topics: Money People Customers Planning & Forecasting Competitive Analytics KPIs Business Performance Small Business big data

IF THERE'S A RECESSION, WILL YOUR BUSINESS SURVIVE?

Not to be alarmist, but there seem to be more and more articles lately like this one from The Wall Street Journal:

RISK GROWS OF MARKETS SPARKING RECESSION

Is the U.S. headed for recession? The markets suggest so.

With Thursday’s sell off, the Dow Jones Industrial Average is now down 14.5% from its all-time high last May. Yields on risky bonds continue to climb, while investors have sought safety in U.S. Treasurys, sending those yields lower. And oil has hit a nearly 12½-year low.

Yet the economic data show no recession. Job growth in January was healthy, and employers are having trouble filling vacancies.

This dichotomy is neatly captured by two indexes compiled by Cornerstone Macro. One, using financial indicators such as the stock market and corporate bond yields, puts the probability the U.S. is now in recession at 50%. The other, which adds in macroeconomic data such as loan delinquencies and inflation-adjusted income, puts the probability at just 28%.

Of course markets often wrongly predict recessions. But in some circumstances they can help bring them about. Economic turning points are unpredictable because they are caused by changes in psychology, not just mechanical factors such as interest rates and wages and salaries. Markets influence that psychology by signaling to businesses whether they should invest or hire. Fear of recession can thus be self-fulfilling.

Since nobody knows if we're really headed for trouble or not, it's probably a good time to take a step back and make sure your company is firing on all cylinders just in case.

So... where to begin?

Topics: Money People Customers Planning & Forecasting Competitive Analytics KPIs Business Performance Small Business big data

Everything you need to know about big data in seven slides

There's so much information out there about big data it's easy to get overloaded.

We sifted through as many of the insights and statistics we could find and pulled together what we think are the seven key take-aways for big data and business:

  1. Companies are generating more performance data than ever before, yet only about 12% of it is being analyzed.
  2. The market for business intelligence and data analysis is projected to grow from around $81 billion today to over $141 billion by 2020.
  3. What does that mean for individual companies? Companies with 1000+ employees are expected to spend about $8m a year on BI & analytics; companies with less than 1000 employees are expected to spend $1.6m.
  4. Why? What do companies that invest in analytics hope to get? 73% expect to increase revenue, 61% expect to improve the quality and speed of decision-making, and 57% expect to improve planning & forcasting.
  5. Do they? According to Bain & Co. and Salesforce, companies that use analytics are 2x more likley to have top-quartile performance, 5x more likely to make faster decisions and 8x more likley to improve operational outcomes.
  6. With findings like that, you'd think every company would analyze its performance data, but that's not the case. Why? Most cite cost and time as barriers, but a lot just don't have the expertise or tools. (Which is why we're in business.)
  7. So who is using analytics? Here are adoption rates by industry.
Topics: Money People Customers Planning & Forecasting Competitive Analytics KPIs Business Performance Small Business big data

Five questions every company struggles with


What's your pain point?

One of the main reasons companies use our strategic management & analysis tool is to identify, isolate and address the issues that are causing them trouble.

What's interesting is that whatever specific problem the company is dealing with — high turnover, bad cash flow, an unengaging brand — it can often be traced back to the same core set of questions or challenges:

  1. How fast should we grow?
  2. How much revenue should we expect from our people?
  3. Do our costs compare to our competitors?
  4. Is our marketing right?
  5. Are we missing anything obvious?

Why are these questions at the heart of so many problems?

Companies aren't as different as they think. Even though the terrain, timing and mode of transporation may differ, the destination is usually the same: a place of where growth, value and profitability are higher.

Perhaps what's more surprising than the fact that most business problems seem to be related to these five questions is the fact that most companies don't bother to integrate the asking and answering of them into their on-going planning process.

Topics: Money People Customers Planning & Forecasting Competitive Analytics KPIs Business Performance Small Business

WHY YOUR MARKETING PROBLEM ISN'T ALWAYS A MARKETING PROBLEM


One of the main reasons companies use our strategic analysis & benchmarking tool is to get better insights out of the data they already collect so they can address pain points  — high turnover, cash flow issues, an un-engaging brand, etc.

What's interesting is that in a lot of cases the root cause of the problem isn't what they thought it would be or where they thought it would be.

How is that possible?

Even though we assign roles and responsibilities by department or functional area, nothing in business is completely isolated. Everything is linked and interconnected in such a way that all these individual actions form a giant kinematic chain in which the "movement" of one affects the "movement" of another, sometimes something that's much further down the line.

This is why a marketing problem isn't always a marketing problem, but can be a company culture problem instead. 

Or a sales problem can be a finance problem.

(The same thing is true for people, which is why knee pain is often traced back to foot problems and limited hip mobility can make your back hurt.)

How do you know when that's the case?

You don't.

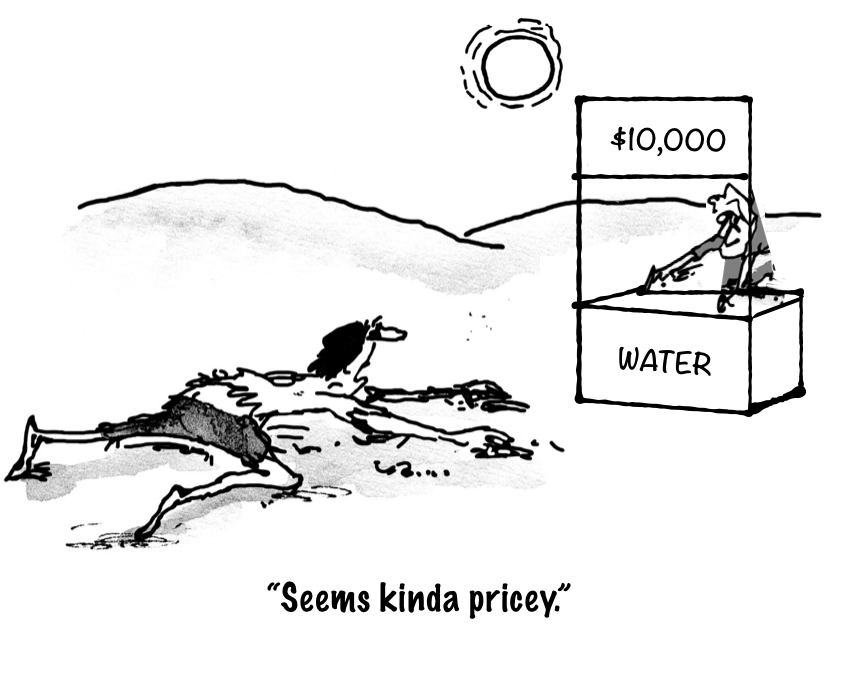
That's why it's important to analyze your performance data. 

Here's an example:

One of our clients came to us because they were having turnover issues. Because we provide both "scoreboard" metrics and "differential" metrics, they were able to rule out the obvious causes: uncompetitive salaries and benefits, limited opportunities for advancement, unrealistic productivity demand, bad management, etc.

What they eventually realized was they actually had a "grass is greener" problem — their employees were leaving because they didn't realize how well the company was treating them and how strongly it was performing — which they solved by sharing their Peerview Data analysis so everyone internally could see just how green the grass really was.

The result?

Over the next two years, they cut their turnover rate in half.

Topics: Money People Customers Planning & Forecasting Competitive Analytics KPIs Business Performance Small Business

FIVE ALTERNATIVES TO EXPENSIVE ANALYTICS

According to Bain & Co., companies that analyze their performance data are 2X more likely to have top-quartile financial performance than companies that don't.

Given a statistic like that you'd think every company would crunch their numbers, but most don't.

Why?

The problem is in order to do this kind of analysis you need both internal and external data — industry benchmarks, competitive comparisons, historical trends, etc. — which most companies don't have.

If you can afford to cough up $$$$'s you can hire Bain & Co. to do this for you, but for most companies that's not an option. 

(FULL DISCLOSURE: we charge $999 for an industry-specific performance analysis.)

What's a small business owner, manager or executive to do?

Topics: Money People Customers Planning & Forecasting Competitive Analytics KPIs Business Performance Small Business

Small Business Stats: Can data help you do better?

Topics: Money People Customers Planning & Forecasting Competitive Analytics KPIs Business Performance Small Business

Small Business Stats: An easy way to boost performance

Source: Bain & Co. 

Topics: Money People Customers Planning & Forecasting Competitive Analytics KPIs Business Performance Small Business

Small Business Stats: explanation or excuse?

Source: Intuit 

Topics: Money People Customers Planning & Forecasting Competitive Analytics KPIs Business Performance Small Business